Global warming is our fault - a detailed walkthrough.
There is a huge political effort to combat Greenhouse Gas emissions, blamed to by the Intergovernmental Panel on Climate Change (IPCC) as the main culprit for the ongoing global warming.
Indeed, the successive Assessment Reports produced by the IPCC since its inception in 1990 have progressively shown increased confidence that:
- Earth is warming at an an unprecedented rate
- Our GHG emissions are responsible for this phenomenon
- The consequences will be disastrous.
If you chain up these three statements, swift action is indeed needed to massively reduce our Greenhouse Gas emissions. So if they all are true, I would need to cancel my next plane trip to Venice. 😭
But since this reasoning is a chain of arguments, the alarmist conclusion is only as strong as the weakest of the links. Since I really want to go to Venice 🛫, let’s go through the reasoning process step by step and try to find a flawed link in the process. 🔎
What is the IPCC? How biased can it be?
Originally, the US Environmental Protection Agency was seeking an international convention to limit GHG emissions. Since the Reagan administration worried that independant scientists would have too much influence, the IPCC was created in 1988 as an intergovernmental body, where scientists would take part both as experts and government representatives.
So the IPCC is both a scientific body and an intergovernmental organization. Its main job is to prepare comprehensive Assessment Reports evaluating the latest state of scientific, technical and socio-economic knowledge on climate change: impacts, risks, and options for adaptation and mitigation. This is an important thing to note: the IPCC reports do not produce any new scientific studies: they only provide an overview of an existing body of science.
“For the Sixth Assessment Report, 743 experts were selected as Coordinating Lead Authors, Lead Authors and Review Editors from about 2,827 nominations.” source: IPCC
Its latest report is the Sixth Assessment Report. As usual, this reports is comprised of three chapters, all built by different Working Groups.
- The Physical Science basis: this is the part where the mechanic tells you that your car had a problem.
- Impacts, Adaptation and Vulnerability: learning to cope with this damaged car.
- Mitigation of Climate Change: how to prevent your car’s state from further deteriorating?
Possible sources of bias towards alarmism
- Could a lobby capture this organization? Well it would probably be quite hard to influence hundreds of the world’s most reknowned subject matter experts. I do not know of any green lobby that would have enough influence and money to do this. Probably if anything is happening, oil companies have much more wealth and power than renewable energy companies so the IPCC would not be biased not towards alarmism but towards “dontdoanything-ism”.
- Could the selection of experts be biased towards certain opinions? This I do not know. There may be a slight bias towards publishing alarmist reports, since journalists love these and increased attention to a subject probably helps to get necessary funding. Just look at the Altmetrics for this article announcing the destruction of most vineyards around the Mediterranean basin that was heavily debunked as I have shown in my other post but was alarmism-sexy enough to be picked up by over 90 news outlets to date. But then I expect this bias to be heavily tempered by facts whenever phenomenons can be measured, and not so much whenever they’re hard to measure (see the replication crisis in psychology). As such, I would tend to heavily trust the Chapter 1 about the Physical Science basis, and take more caution with the chapters 2 and 3, since they rely on many more future projections and interpretations.
1. Earth is warming at an unprecedented rate: prove it!
1.1 “Earth is warming”: is it really?
How does the IPCC define global warming?
“warming is defined as the increase in the 30-year global average of combined air temperature over land and water temperature at the ocean surface” IPCC FAQ
🏗 The concept of a “global temperature” is a construction: observations of a network of thermometers based on the ground, on boats, and buoys, are averaged and weighted by the surface covered to finally obtain a reconstructed global temperature. These measurements date back to 1850, when large numbers of thermometer records started being available.
](/assets/images/2023-10-31-the-hand-of-humanity-in-global-warming/short-term-warming.png)
▶ As you can see, these aggregated measurements clearly show that a global average warming is happening since then. Of course, as a rough aggregate, the concept of “global warming” covers wide temporal and spatial variation. For instance, locally some places could keep the same temperature or even become cooler on average.
1.2 “At an unprecedented rate”: what about past centuries?
What does the curves above really mean in a wider context? Surely the climate has already varied in the past as well? For instance, the time when Greenland could receive its name, or the “Medieval Optimum” were surely periods as warm as the current period? 🤔
The only way to get an idea of the temperatures before 1850 is to go through proxies, historical artifacts allowing us to derive estimates of temperatures. Such a study was done in 2019 by Pages2K team source, building on their extensive database published 2 years earlier.
You can find their reconstructed temperatures below. The very steep variation making us cross all previous boundaries in only 50 years certainly makes the “Medieval Optimum” pale in comparison. 🚀
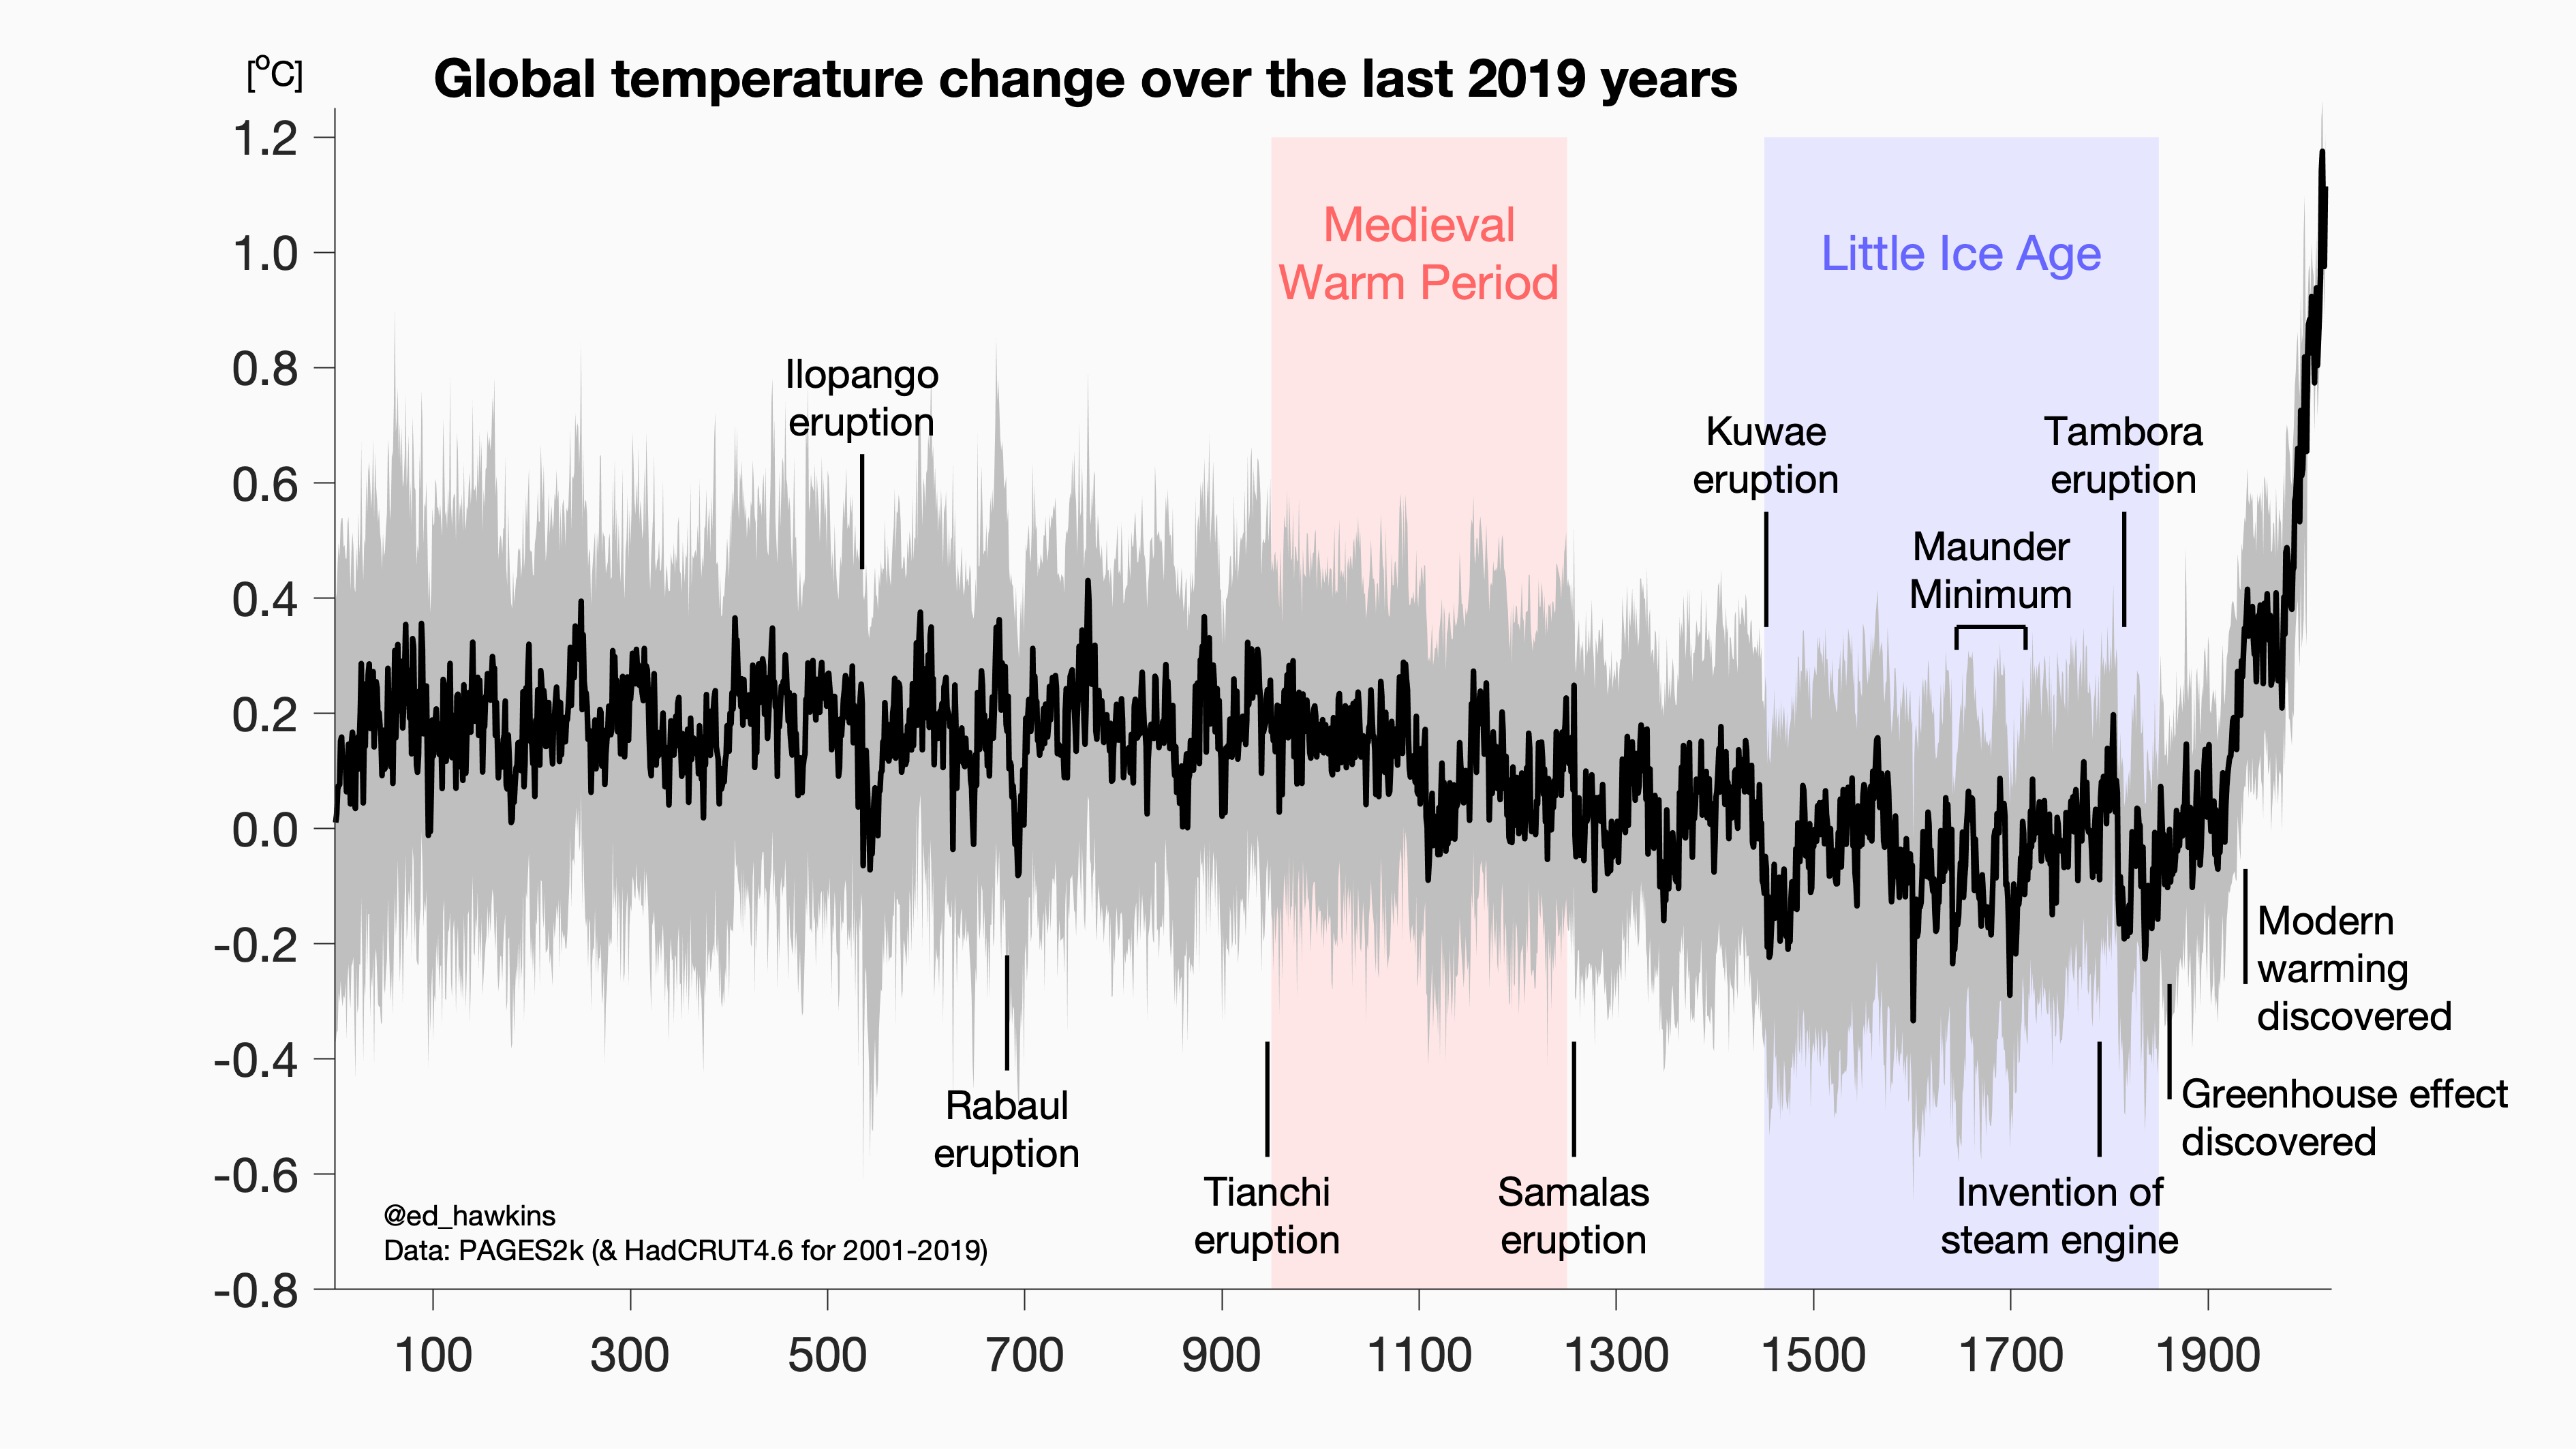
▶ Now the evidence above makes me certain that we’re witnessing something unprecedented and potentially alarming.
2. Our GHG emissions are responsible for this warming: are they?
2.1 What about other possible causes?
Well, let us take an engineering approach to the question. We will list potential causes of warming and try to eliminate each of these suspects one by one.
Warming of the atmosphere is an increase of its energy. It can be only due to a change in energy flows. Let us list these flows of energy.
The only exchanges of the system (Earth + atmosphere) with the outside are:
- inbound solar radiation
- outbound terrestrial radiation (earth radiates as a Black body)
So the variation of its energy will come from the balance in these radiative energy flows, named radiative forcing. If the sum of radiative forcing is positive, the atmosphere will heat up.
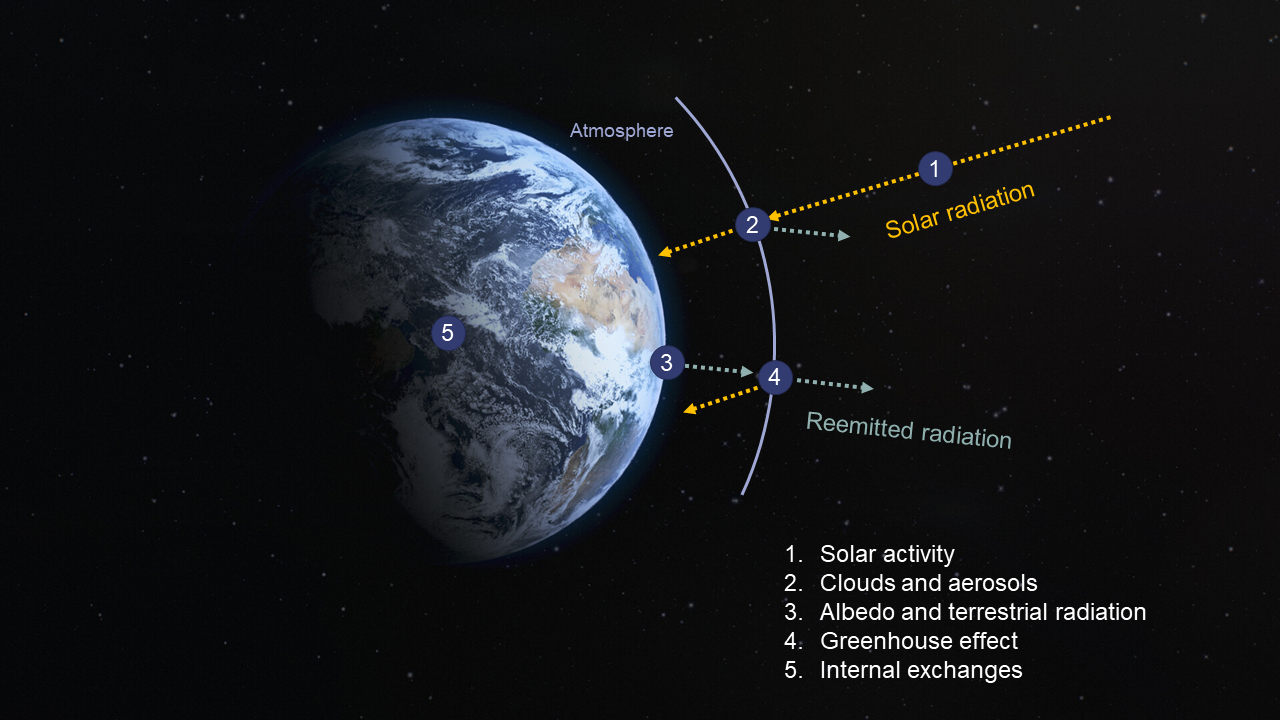
We can further decompose the inbound and outbound radiative forcings into several flows displayed in the figure above.
- Solar radiation arrives on the atmosphere
- Clouds and aerosols block some of this inbound solar radiation
- The solar radiation arrives on earth. In turn, albedo and black body radiation create outboud energy emissions
- Greenhouse effects block some of these outbound radiations
On top of these, we add the internal exchanges as a fifth and sixth flow.
5.Energy exchanges of the atmosphere with the surface of Earth
6.Internal changes in the atmosphere
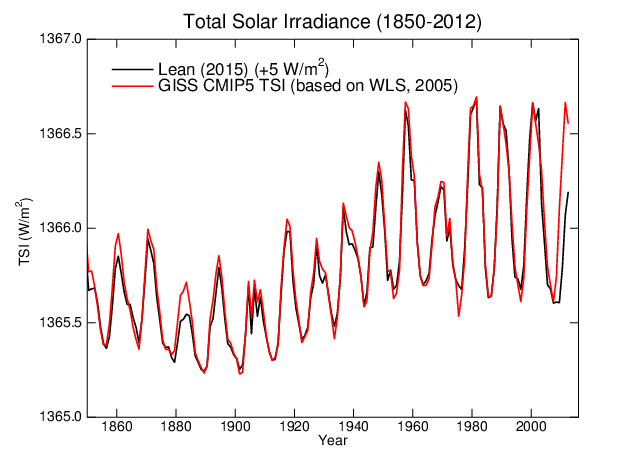
Now since the temperature of the atmosphere is responsive to 11-year long solar cycles, it has an inertia under 11 years, which is short compared to the warming trend that we observe since 1950. So the culprit of global warming should show a visible trend in the last ~60 years.
Let us review each of the energy flows above and try to find the culprit. 🔎
☀ Solar irradiance
☁ Clouds and aerosols
Aerosols are a suspension of fine solid or liquid particles in gas: natural or pollution clouds belong in here, just like smoke from wildfires or dust ejected by volcanic eruptions. Depending on the specific particle scattering, reflecting or absorbing sunlight, they can have either cooling or warming effects. These effects are often felt on a local scale. For instance, black carbon particles emitted by fires can settle on ice an reduce its albedo (its tendency to reflect light), thus leading to more heat intake and hastened ice melt. On the opposite, volcanic eruptions cool the climate :
Aerosols can have a major impact on climate when they scatter light. In 1991, the eruption of Mount Pinatubo in the Philippines ejected more than 20 million tons of sulfur dioxide—a gas that reacts with other substances to produce sulfate aerosol—as high as 60 kilometers (37 miles) above the surface, creating particles in the stratosphere. Those bright particles remained above the clouds and didn’t get washed from the sky by rain; they settled only after several years. Climatologists predicted global temperatures would drop as a result of that global sulfate infusion. They were right: Following the eruption, global temperatures abruptly dipped by about a half-degree (0.6°C) for about two years.
Since volcanic eruptions have a negative impact on temperature, the warming could only come from a reduction in volcanic eruptions, which does not seem to be an existing trend.
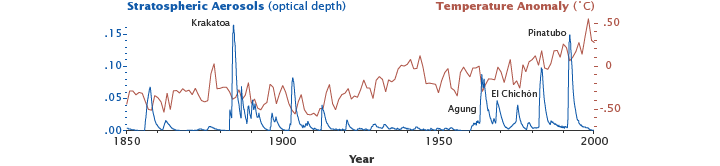
Overall, aerosols are believed to have a strong negative impact on the atmosphere’s energy balance1. So they are not the cause we’re looking for.
🌍 Reflectance / Albedo and radiation by Earth Surface
Albedo is the proportion of incoming sunlight reflected by the earth’s surface : it is never negative since Earth’s surface never absorbs 100% of incoming sunlight, but it varies between 0 and 1, and it is highest on very reflective surfaces like ice. It is one of the three most important factors of global temperature 2.
Earthshine was first explained by Leonardo DaVinci (c. 1510), as sunlight reflected from the dayside Earth to the dark portion of the lunar disk as seen from the nighttime Earth. Our observations of the earthshine (or “ashen light”) were made from BBSO in California using modern photometric techniques. The globally integrated Earth’s albedo measured using earthshine (Goode et al., 2001) is 0.3 in the visible range. 2
Albedo is shown to have a negative impact on total radiative forcing 3 : so more albedo leads to a cooler atmosphere.
ALthough the measured albedo had been stable until 2013 4, measurements since then have shown a significant drop since then 2, partly due to changes in cloud cover off the west coasts of North and South America. Here, data collected is only available since the year ~2000, which is too short to untangle a real effect, but scientists generally believe that albedo is not the main cause of climate change.
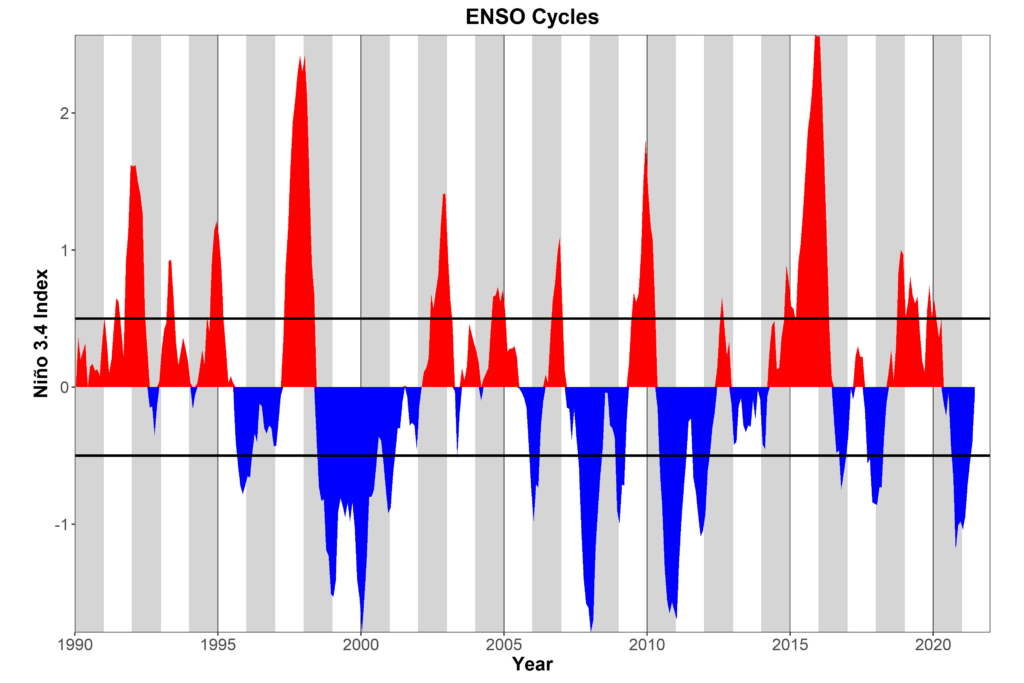
⚖ Internal variations
Atmosphere is affected by several so called “oscillations”, simili-periodic imbalances lasting several years that affect global temperatures. The most important one is ENSO, also named El Nino / La Nina. As you can see, it does not display marked trends over the last decades.
Greenhouse gas
French scientist Joseph Fourier observed in 1824 that if we only take into account the balance of energy between solar irradiance and outbound radiation something is missing, because planetary temperatures should be much colder than they are: he postulated that the atmosphere acts like the glass of a greenhouse, selectively letting in sunrays and preventing heat from escaping 5. Full calculations were laid out later by the swedish scientist Arrhenius, who precisely calculated an elevation of temperature of ~4°C if the quantity of atmospheric CO2 was doubled 6, and was the first to propose this strong impact of atmospheric CO2 concentration on temperature as the main reason for the 10°C temperature variations observed in paleoclimate.
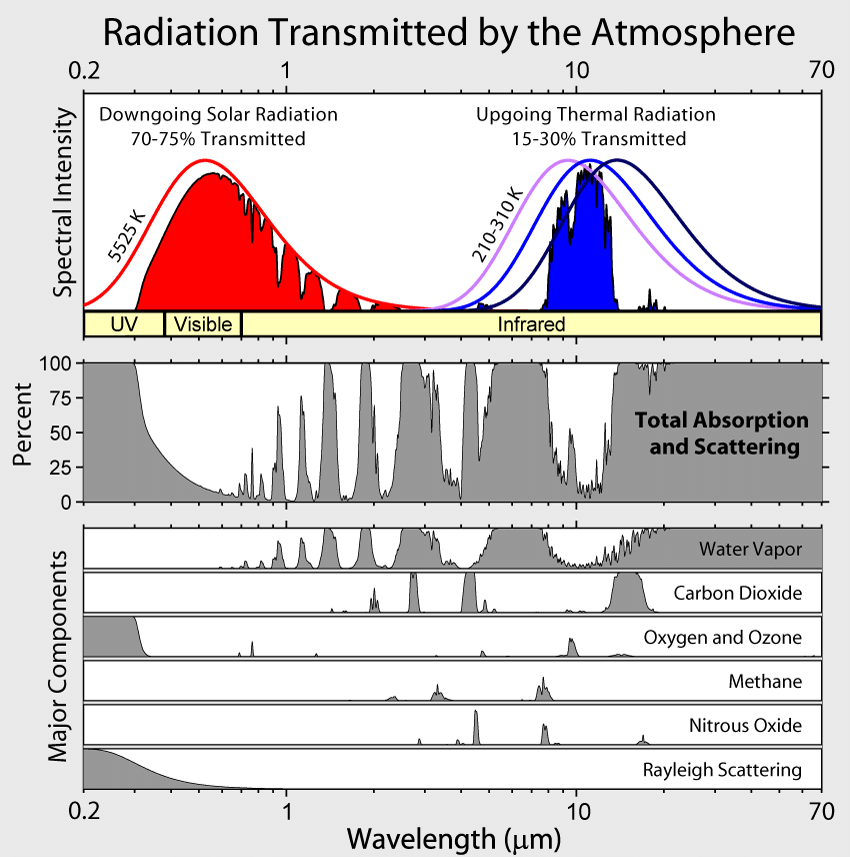
How can the atmosphere act like like greenhouse, letting in sunrays and selectively blocking outgoing radiation?
Solar irradiance and outbound terrestrial radiation have very different wavelengths. The so-called “greenhouse gases” (GHG) absorb much more energy in the wavelengths of terrestrial radiation, resulting in the greenhouse effect. (cf. figure below)
So, was there a marked trend in atmospheric GHG concentrations in the last decades ? Oh my dear, yes there was. Just look at the figure below.
2.2 Culprit identified: humanity 🫵
You can define a common quantity named CO2 equivalent (CO2e) to aggregate the absorption power of all GHGs: CO2e is the “equivalent quantity of CO2 that would create as much greenhouse effect as all the considered GHGs combined”. The good thing is that CO2e cumulated emissions historically have a nearly perfect linear correlation with global warming. Correlation is not causation of course, but here the causation seems clear as well.
So it looks like we’ve found the culprit for warming! 🥳🥳 It’s us. Yes, we’re the ones who have been emitting all these GHGs since the Industrial Revolution.
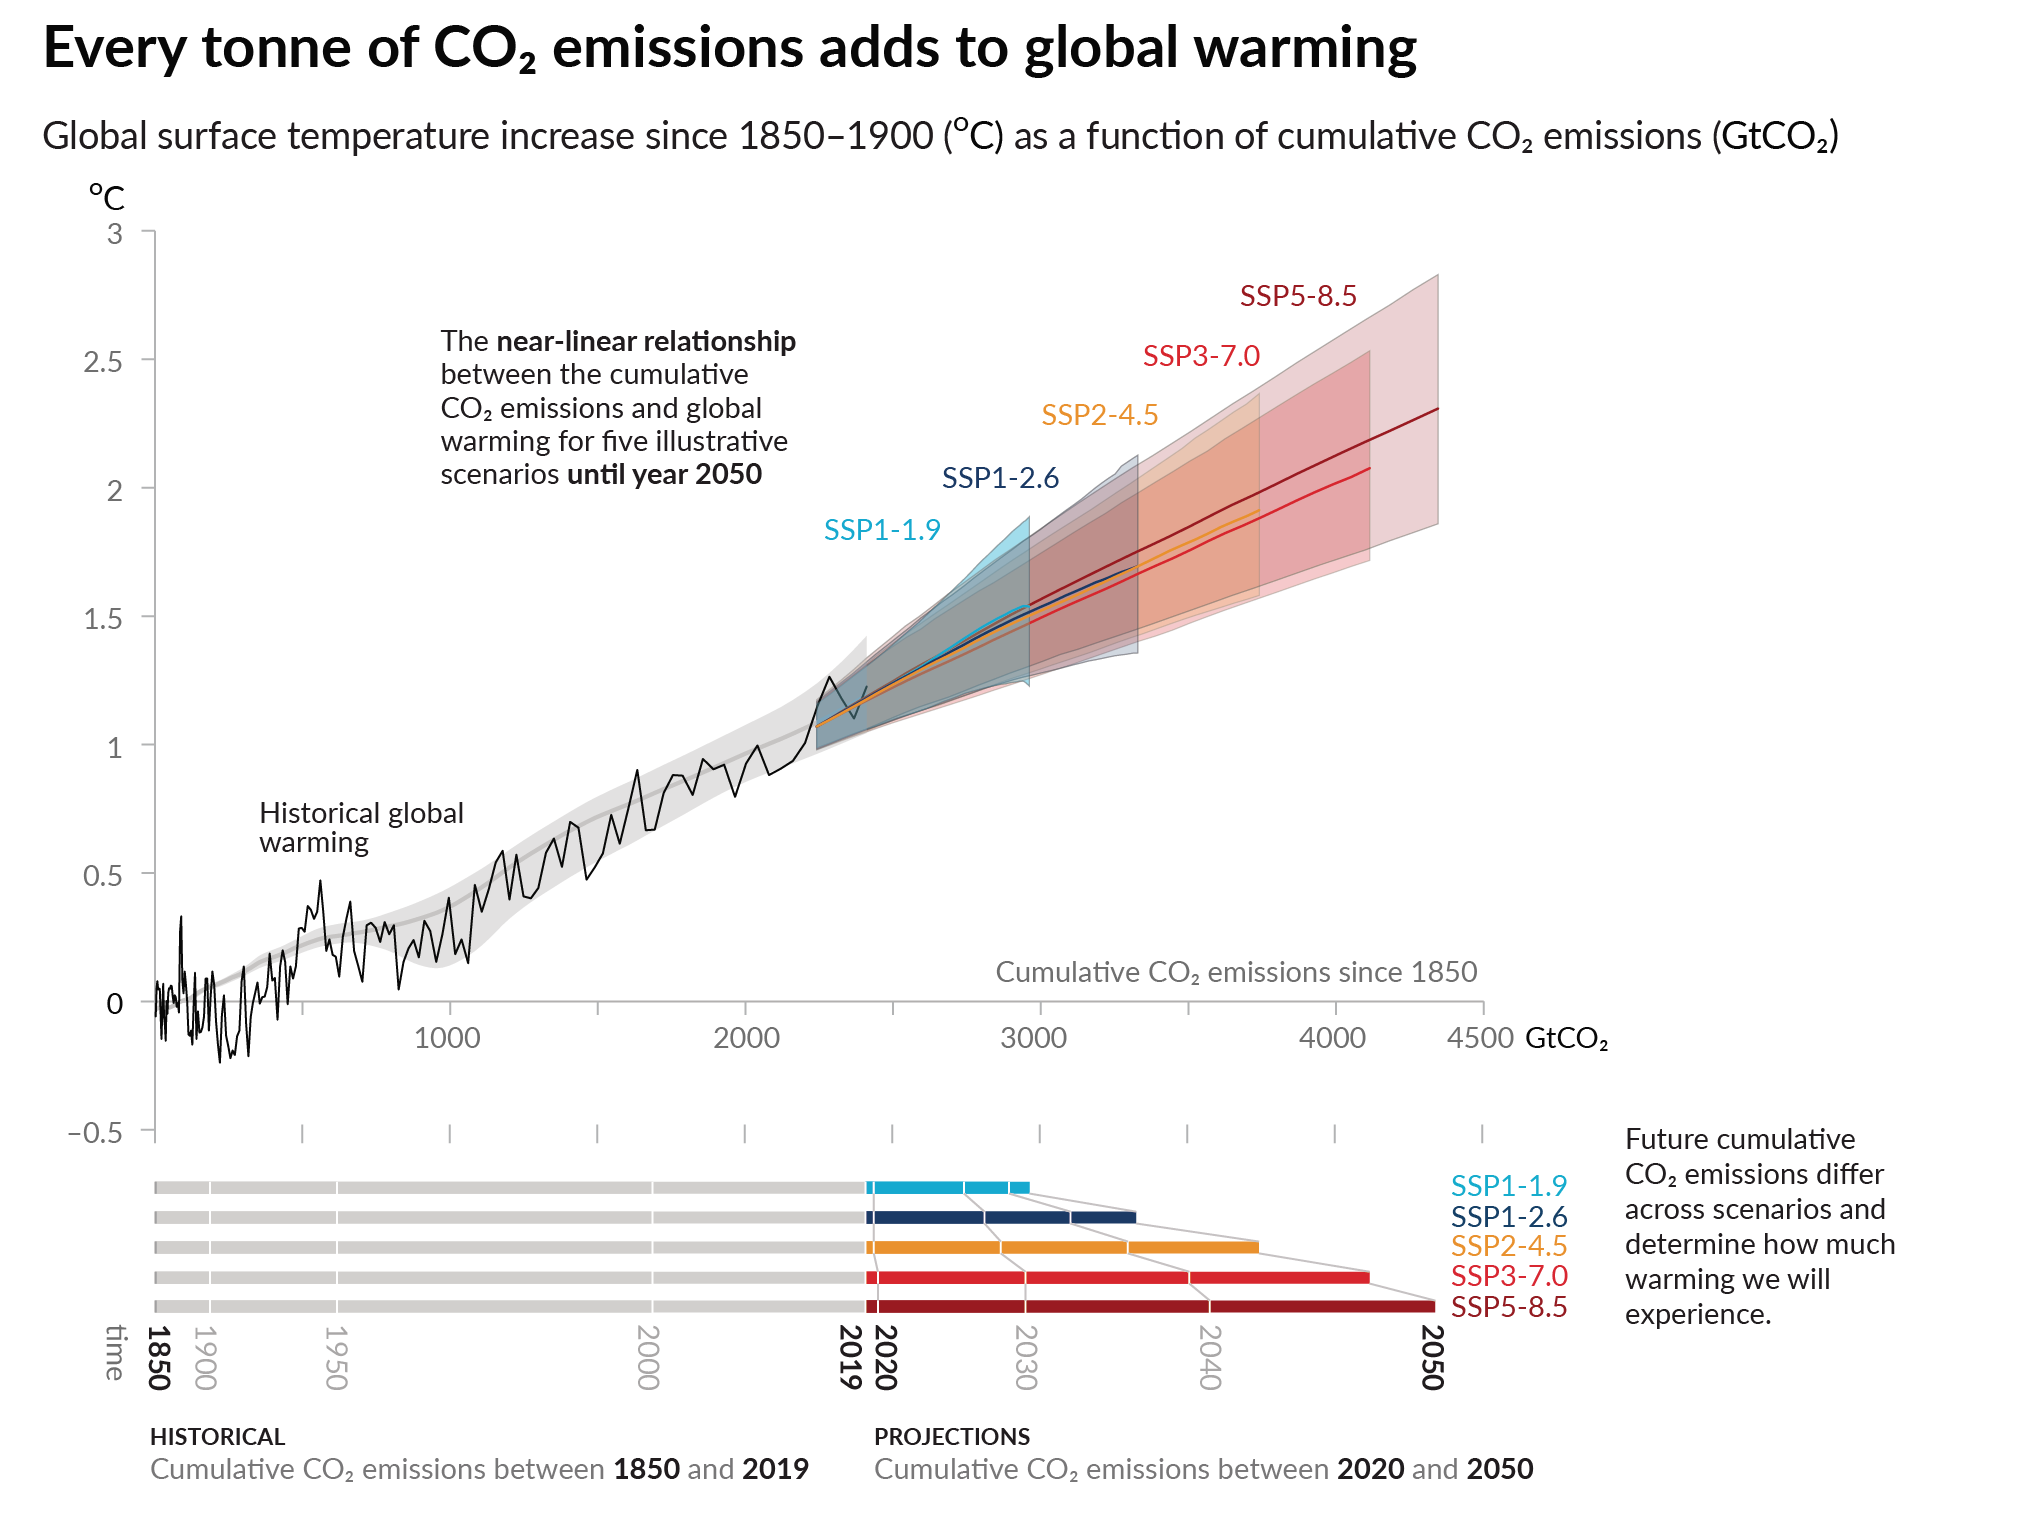
And the best thing is that figure helps forecast future temperature increase depending on CO2e emissions. Which is a bit scary, to be honest.
Now, that’s the end of our study for today! The careful reader that you are has probably noticed that point 3 of the IPCC’s thesis (“the consequences will be disastrous”) is not treated yet: this will be done in a later blog post.
Now, you will find many other people try to poke holes in the “Global warming is caused by our GHG and it will have bad consequences” thesis. Their arguments take a lot of effort to refute. See for instance this discussion where to debunk false claims from a book by Steven Koonin, 3x as much effort is needed in careful explanations. But you can filter most of the bullshit yourself. Here are a few questions to ask:
- is the author reputable / publishing in a reputable journal? Because reputable authors and journals have skin in the game: they can lose this reputation if they lie, contrary to the random stranger starting a climate blog post on the internet.
- do they cite scientific sources as well as sources for their data?
- do they provide a broad overview of arguments for and against each thesis?
-
“Scientists believe the cooling from sulfates and other reflective aerosols overwhelms the warming effect of black carbon and other absorbing aerosols over the planet.” NASA’s Earth Observatory ↩
-
“We measure a gradual, but climatologically significant 0.5 W/m2 decline in the global albedo over the two decades of data.”Goode et al. 2021 ↩ ↩2 ↩3
-
“Results from the models and simulations analyzed here support the notion that an increase in surface albedo has a local cooling effect by increasing the total outgoing radiation. Most existing studies indicate a similar response: an increase in surface albedo yields a reduction in RF or an increase in outgoing radiation.” MIT 2015 Research Brief “The Impact of Changes to Surface Albedo on Radiative Forcing” ↩
-
“We find two modest decadal scale cycles in the albedo, but with no significant net change over the 16 years of accumulated data.” Palle et al. 2015 ↩
-
Fourier, Annales de Physique et de chimie, 1824 ↩
-
Arrhenius, On the influence of Carbonic acid in the Air upon the Temperature on the Ground, 1896 ↩